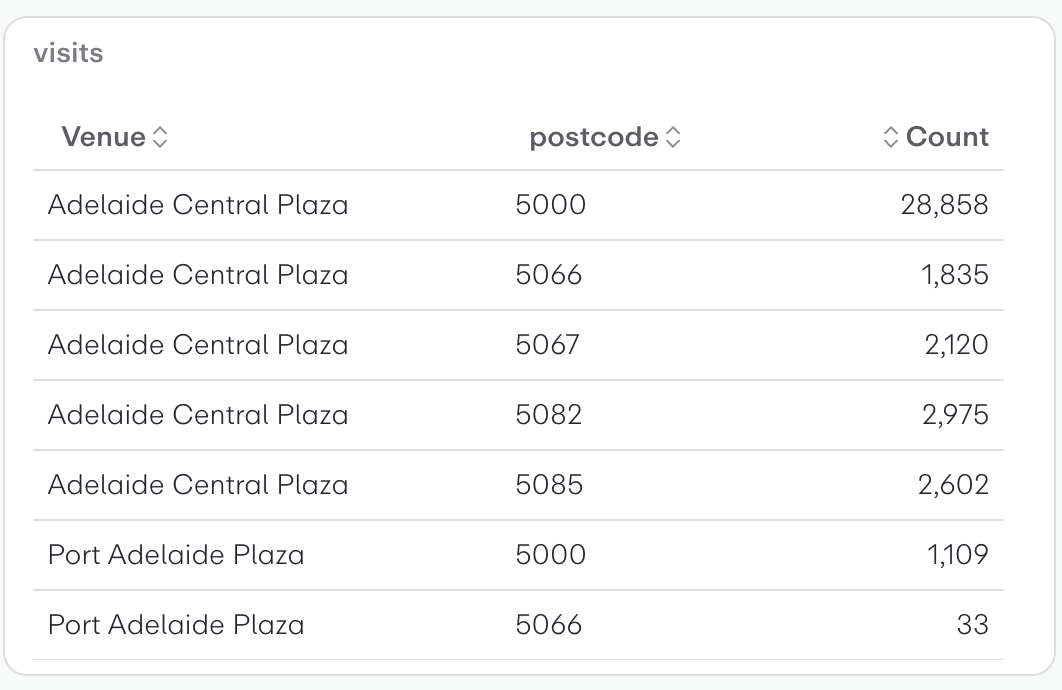
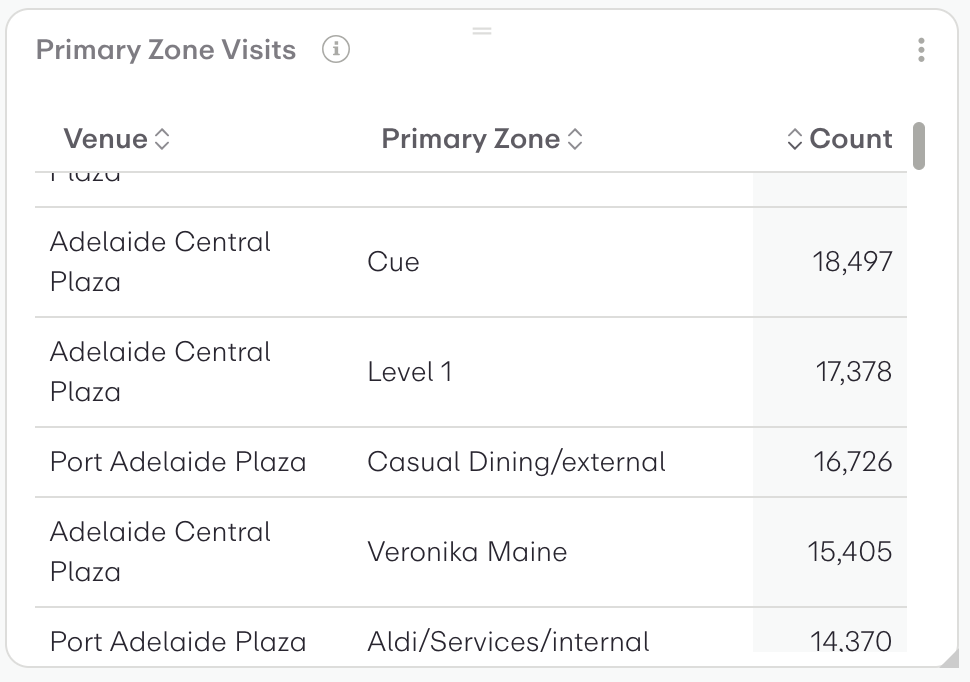
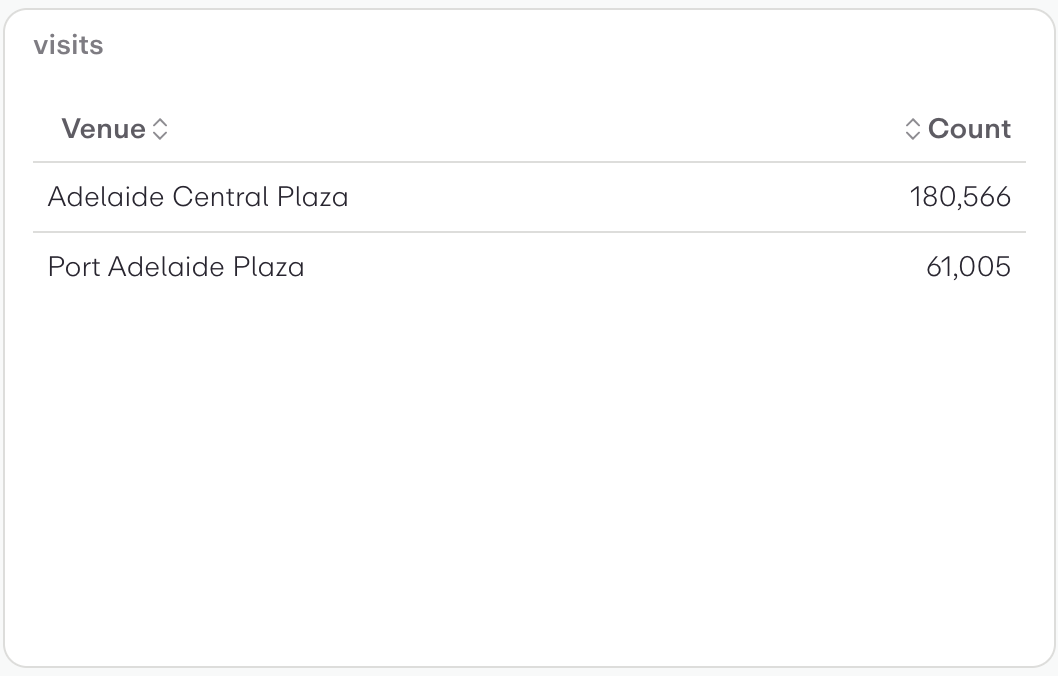
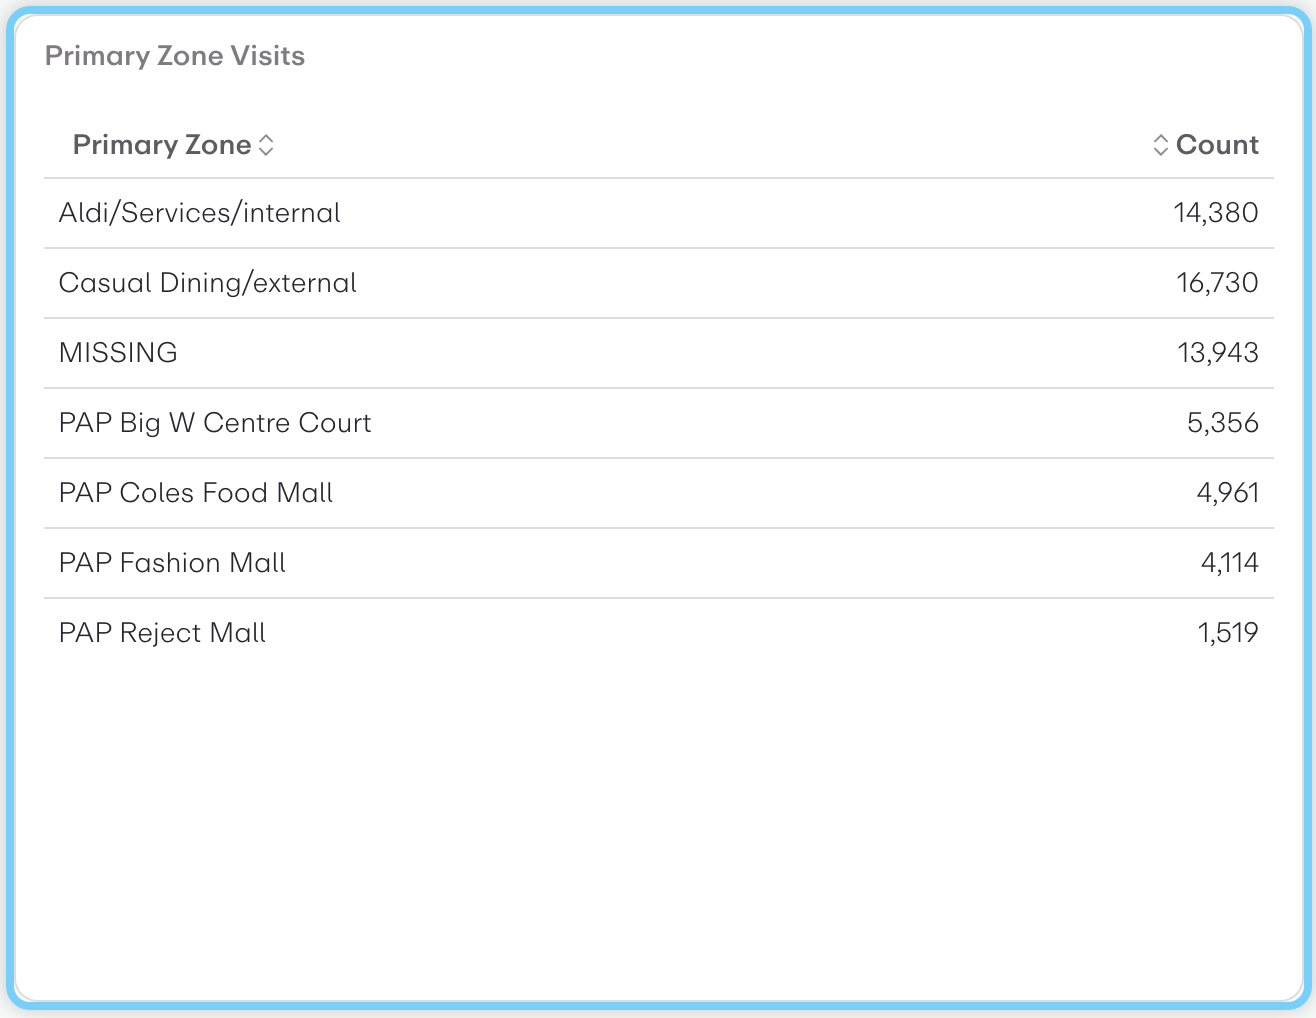
Beonic Insights 3.0 Widget Examples
This is a tabular data visualization showing "Postcode Clicks" performance metrics. The table displays three columns:
This is a tabular data visualization showing email campaign performance metrics across different event types.
Campaigns and postcodes of the registrations engaging with them
Count campaign events
This is a table visualization showing weekly email campaign performance data.
This is a tabular data visualization showing "Auto Triggered by Venue and Zone" data for Pran Central shopping center.
Percentages of Males and Females
This is a tabular data visualization showing campaign click data segmented by gender across specific postcodes (5000, 5082, 5085, 5066, 5067).
This is a table visualization showing campaign click performance data. It displays:
This is a table visualization showing "Clicks by URL" data. It displays:
This is a table visualization showing "Day Of Week Clicks" data with two columns: Date (days of the week) and Count (number of clicks).
This is a simple metric card or KPI widget displaying a single data point. The visualization shows:
User profiles friendly labels for enum/boolean values
This is a time-series table visualization showing 15-minute interval signup data for Saturday, September 13, 2025.
This is a time-series data table showing 5-minute interval signup data for Saturday, September 13, 2025.
This is a simple data table visualization showing "Signups by Part of Week."
This is a table visualization showing "Signups by Day of Week" data. It displays signup counts for each day of the week in a simple two-column format with days listed vertically and corresponding signup numbers on the right.
This is a table visualization showing daily signup data over a one-week period in September 2025.
This is a two-column data table showing "Signups by Hour of the Day."
This is a tabular data visualization showing "Hourly Signups" for Saturday, September 13, 2025.
This is a time series table showing "Minutely Signups" data from Beonic Insights.
This is a data table visualization showing "Signups by Month of the Year" with two columns: Month and Signups.
This is a tabular data visualization showing "Monthly Signups" data in a simple two-column format.
This is a table visualization showing weekly signup data over time from January to March 2025.
This is a simple data table visualization showing "Yearly Signups" over a three-year period. The table displays:
This is a data table visualization showing gender demographics of visitors across two venues. The table displays visitor counts broken down by three gender categories (Female, Male, Other) for Chevron Renaissance and MacArthur Central.
This is a tabular data visualization showing visitor counts by venue and postcode. The table displays:
This is a tabular data visualization showing "Primary Zone Visits" with three columns: Venue, Primary Zone, and Count.
This is a tabular data visualization showing venue visit counts. The widget displays:
This is a tabular data visualization showing "Primary Zone Visits" with two columns: Primary Zone names and their corresponding visit counts.
This is a table visualization showing "Primary Zone Visits" data. It displays visit counts for different zones/locations:
Creates a histogram of user visit by age range. The histogram's buckets and counts are visualised as a bar chart. The buckets are default (yearly) age ranges.
This is a histogram bar chart showing the distribution of website visit durations measured in minutes. The chart displays visitor counts (y-axis, ranging from 0 to 40k) across different time duration bins (x-axis).
This is a line chart showing website visits over time periods. The visualization displays:
This is a histogram bar chart showing the distribution of Primary Zone visit durations in minutes. The chart displays visitor counts across different time intervals:
This is a tabular data visualization showing monthly website visits from January to September 2025.
This is a cross-tabulation table showing OS category usage (Android vs iOS/OSX) across two venues.
This is a simple data table visualization showing session counts by venue. The table displays two locations:
This is a data table visualization showing WiFi session counts by day of the week.
This is a histogram bar chart showing the distribution of WiFi session data usage measured in megabytes (MB).
This is a histogram bar chart showing the distribution of WiFi session durations measured in minutes. The chart displays 8 duration ranges from "0-5" minutes to "301+" minutes on the x-axis, with the number of sessions (in thousands) on the y-axis.
This is a line chart displaying WiFi session frequency throughout the day, showing time periods on the x-axis (from 0-100 to 2100-2200) and number of sessions on the y-axis (ranging from 0 to 15k).
This is a horizontal stacked bar chart showing monthly WiFi session data usage distribution across different usage ranges (measured in MB) from 2024 through December.
This is a horizontal bar chart displaying monthly WiFi sessions data. The chart shows WiFi usage patterns across different months, with each blue bar representing the number of sessions for that period.
This is a simple data table visualization showing "Yearly WiFi Sessions" data.
This is a histogram (bar chart) showing the distribution of ages in years across a population.
Count registrations by country and state
Count registrations by County Calling Code
This is a pie chart titled "Device Category (with missing)" that shows the distribution of device types used to access a service or platform.
Subscribed registrations with Email
Group registrations by Single Choice Extended Attribute answers
This is a horizontal bar chart showing gender distribution data across four categories: Female, Male, Missing, and Other.
Percentages of Males and Females
Count Male registrations
Count registrations
This is a horizontal histogram/bar chart showing age distribution across different age groups measured in years.
This is a histogram table showing the age distribution of a population across predefined age brackets (inline buckets). The visualization displays:
This is a histogram table displaying age distribution data with inline bucket notation. The visualization shows:
This is a metric card or KPI widget displaying a single key performance indicator.
This is a histogram table showing the distribution of country calling codes by numeric ranges. The visualization displays:
This is a histogram table showing the distribution of postcode numeric ranges and their corresponding frequencies.
This is a cross-tabulation table (contingency table) showing the distribution of user signups by age group and month.
This is a histogram table showing the distribution of birth years across three time periods using inline buckets.
This is a pie chart visualization showing the distribution of "Non-En Languages" (Non-English Languages) with a total of 200 data points.
Subscribed and Unsubscribed users by Marketing List (and registration status is subscribed)
This is a pie chart visualization titled "Non-En Locales" showing the distribution of different language locales or regions.
This is a pie chart titled "OS Category (with missing)" that displays the distribution of operating systems in a dataset.
This is a simple data table visualization showing OS (Operating System) category distribution between Android and Apple devices.
Postcode
Count registrations by Australian Postcodes
Group registrations by Single Choice Extended Attribute answers
Registration Status
Opted-in Subscribers by Marketing List (and registration status is subscribed)
Count registrations by Australian Suburbs
This is a histogram/bar chart showing the distribution of birth years from 1915 to 2011. The visualization displays:
A table